
Published: 21st May 2021 | © Anthias Consulting Ltd
Techniques such as Mass Spectrometry (MS) can produce ten to hundreds of thousands of data points per sample. In these cases, it is impossible to satisfy the statistical experiment design goal of having substantially more sample replicates than variables. If you have lots of extracted compound peaks, then some will appear to be significantly different purely by chance. This may be apparent in your ANOVA test or when you visualise the data with something like Principle Components Analysis. This can be quite a problem, for example:
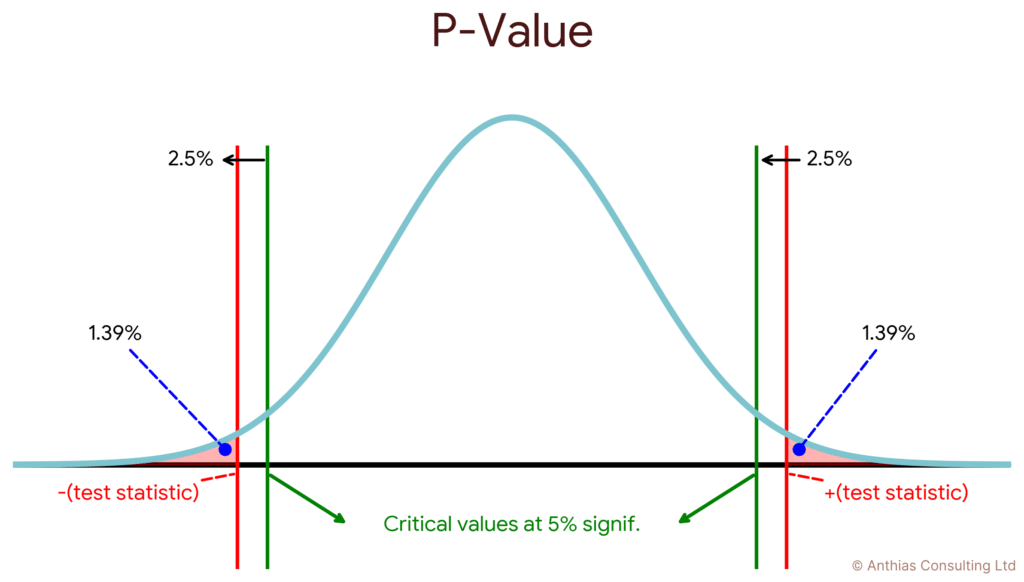
- Taking a data set of 10,000 peaks or features = 10,000 individual significance tests theoretically that could be performed with a p-value of say 0.05 (5% error) (Figure 1). If you do the maths, this then equates to 500 features (0.05 x 10,000) which will be predicted to be statistically significant purely by chance. What can we do to help this?
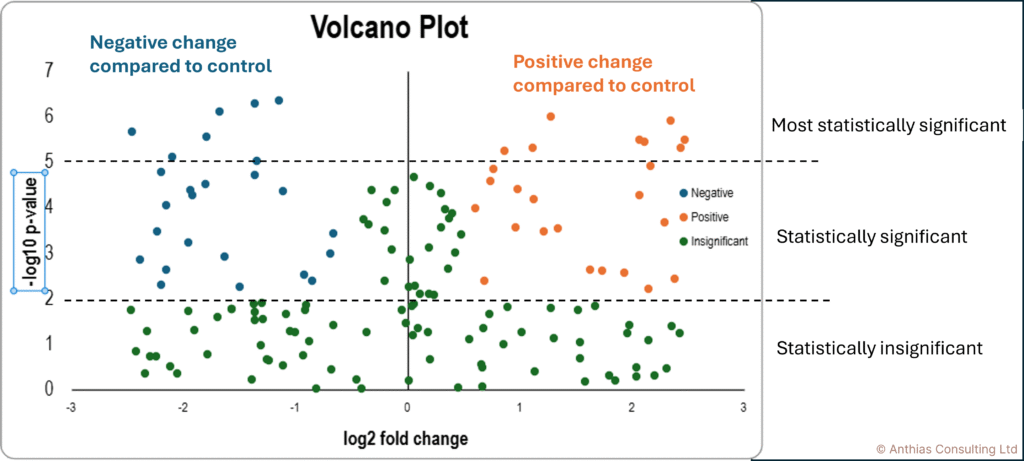
Part of the answer is to perform Quality Control (QC) checks before doing full statistical analyses, to filter out and to decrease false positives. For example, a QC check could require a data feature to be present in say at least 75% of replicates or even 100%. We might want to only to consider features with a certain Fold Change increase or decrease from a control. Also, fold-changes and variability together can be considered in a so called “Volcano Plot” (Figure 2). Whichever techniques are used, the idea is that we want to concentrate our subsequent statistical analysis on features that are reproducible and strong, thus reducing the likelihood of observing false positives in statistical and modelling analysis.
A complementary approach can be applied post-significance testing, by performing “Multiple Testing Correction” techniques to further decrease the number of false positives. Two common methods used are:
- “Bonferroni” where we choose a p-value (e.g. 0.05) then divide it by the number of entities (e.g. 1000 peaks) 0.05/1000 = 0.00005. A peak/compound would be considered significantly different only if the P-value is below 0.00005. It is quite a conservative approach and greatly reduces false positives, but false negatives can increase.
- Benjamini Hochberg FDR (False Discovery Rate) is less conservative than Bonferroni so generates more false positives but fewer false negatives. To perform it, P-values for all tests are sorted in ascending order. The position of each test is divided into the total number of tests. That value is then multiplied by the calculated P-value. The result is the new corrected P-value.
Luckily, you don’t need to calculate these yourself. Any serious software package should include these tests and the best way to understand their effect is just to play around with your data sets.
There are no hard and fast rules about how to filter your data or test for its significance or false discovery. What is vital, is to try to always ask yourself “does this make sense” and to do that you need to understand the system you are working with and contextualise the statistical outcome within that. As I often say to clients and students “Statistics is not an exact science”!
To learn more about chemometrics attend:
- Absolute Basics of Chemometrics
- Absolute Basics of Metabolomics
- Comprehensive Metabolomics (Agilent MHMPP)
- Comprehensive Chemometrics (Agilent MHMPP)
To learn more about QC checks attend:
Don’t forget that you can also subscribe to our newsletters and receive useful tips straight to your inbox!


