
Published: 18th August 2026 | © Anthias Consulting Ltd
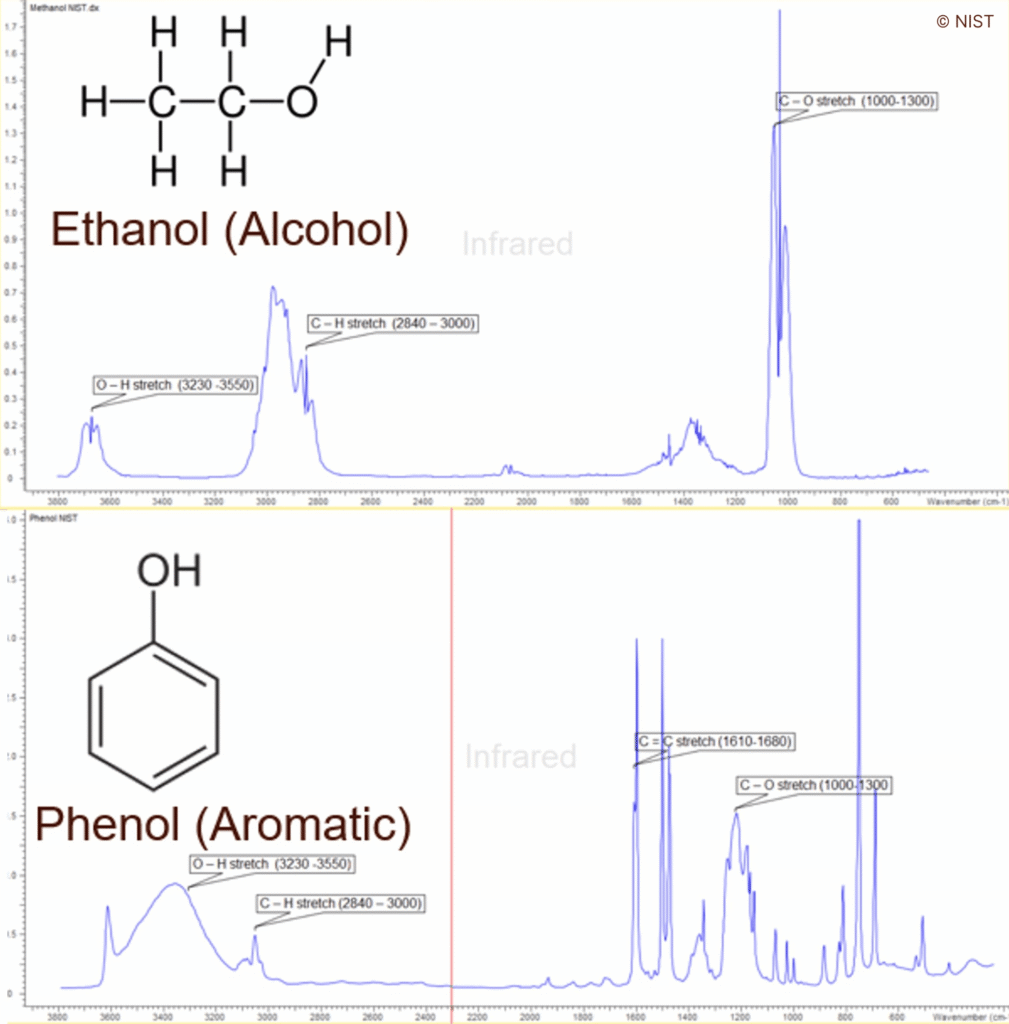
In FTIR – hundreds of thousands of reference spectra are available via many suppliers but are often collated and offered on single websites. Full spectral searching, multiple regions searching, browsable libraries and batch searching for multiple samples are all widely available.
For pure (or nearly pure substances) clear differences can be seen in the spectra and they are easily identifiable when library searching, as shown in Figure 1 as examples of the differing spectra of aliphatic and aromatic structures. Quantitation can also be performed.
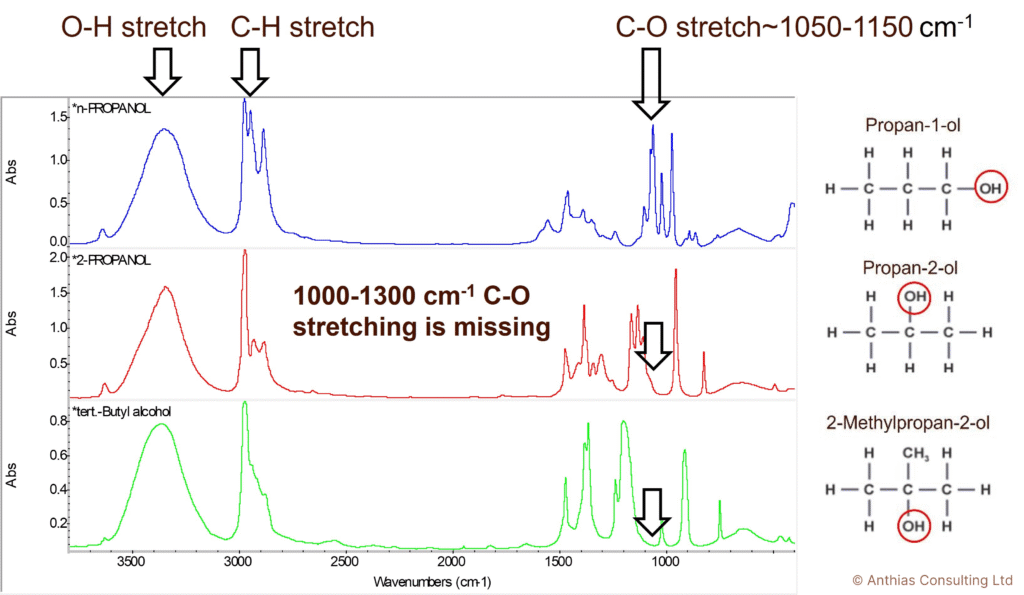
One of the advantages of identification using FTIR over, for example, mass spectrometry, is the ability to differentiate isomers. Figure 2 shows the spectra and their differences for propan-1-ol, propan-2-ol and 2-methylpropan-2-ol.
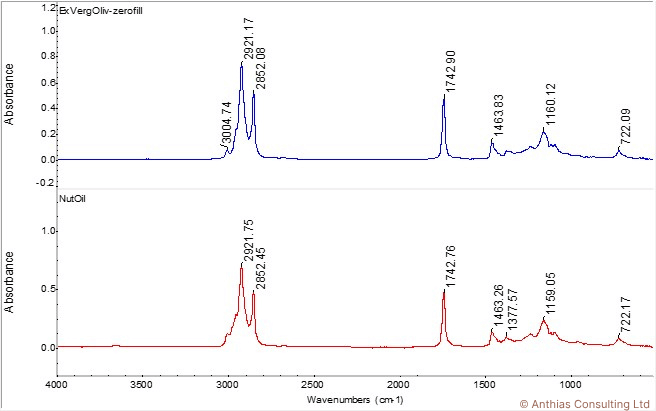
When analysing a mixture, it is much more difficult to differentiate differences visually, as shown in Figure 3 when comparing olive oil (top) and nut oil (bottom) where the only difference is the peak at 2980 cm-1. Qualitative spectral comparisons can be made using multi-variate analysis (MVA), the most common is using principal components analysis (PCA) to ask investigative questions.
 |
 |
To learn more about FTIR attend
To learn more about FTIR spectral interpretation attend
To learn more about chemometrics attend
Don’t forget that you can also subscribe to our newsletters and receive useful tips straight to your inbox!


