Submitted by admin on
 Shewhart Charts (invented by Walter A. Shewhart c1920s) are statistical process control charts used to determine whether a manufacturing process (e.g. in the modern day a laboratory generating analytical results) is working predictably.
They are based on a Gaussian or Normal distribution of data.

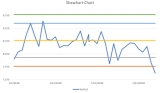
If we were to analyse a compound (a chromatographic peak) one hundred times under identical method conditions and analyse the area counts of each, statistically a large percentage of the dataset will fall within two standard deviations of the mean, similarly a much smaller percentage will fall within three standard deviations. From these facts we can build a control chart and historically these have been primarily used to track the Analytical Quality Control (AQC) sample, which is associated with batches of real samples, the results of which can only be released should the AQC 'pass' the Shewhart Chart protocols.

Statistically, two consecutive 2s breaches are unlikely (so we reject the batch), a 3s breach is very rare but is so out of control that once again a batch is rejected and, in this case, a likely gross error will need to be investigated. Similarly, nine consecutive points one side of the mean (even if they move up and down and are inside the 2s boundaries) is an undesirable trend and should be treated in the same way as two consecutive 2s breaches. Likely causes of 2s breaches are usually a lack of attention to detail in say, routine instrument maintenance, the quality of working standards, the quality of the AQC standard or the efficiency of the extraction process.
Whilst the AQC sample is the most important in the Lab when it comes to releasing results, other system suitability protocols can also be observed via Shewhart charts:
Peak Tailing factors, Resolution factors of co-eluting peaks, Internal Standard areas and Signal to Noise ratio of a target compound are all greatly informative with respect to historical chromatographic performance.
In conclusion, investing time in the controllables can tighten a method to a point where it largely runs itself.